Project overview
UW-River Falls men's basketball needed a way to track plus-minus, a stat their existing software didn't provide but one the coaches considered essential for evaluating role players, especially the guys logging ten to fifteen minutes a game. A trusted campus professor put together a three-person student team, two classmates and me, to build the coaches something they could log into and use directly.
I was primarily responsible for data extraction and storage, database schema design, the Streamlit dashboard, and keeping the reporting side of the project organized. The result was a password-protected Streamlit app that lets coaches pull plus-minus by player, lineup, or opponent tendency across any game or combination of games. It's still in active use today.
- ClientUW-River Falls men's basketball coaching staff
- TeamThree students, advised by a campus professor
- DurationMarch to May 2026, about six weeks
- My roleData extraction and storage, schema design, ETL pipeline, Streamlit dashboard, team coordination
- TechnologyPython, pdfplumber, SQLite, Streamlit, GitHub
- Primary objectiveGive coaches plus-minus by player, lineup, and opponent from the published game PDFs
Context and problem
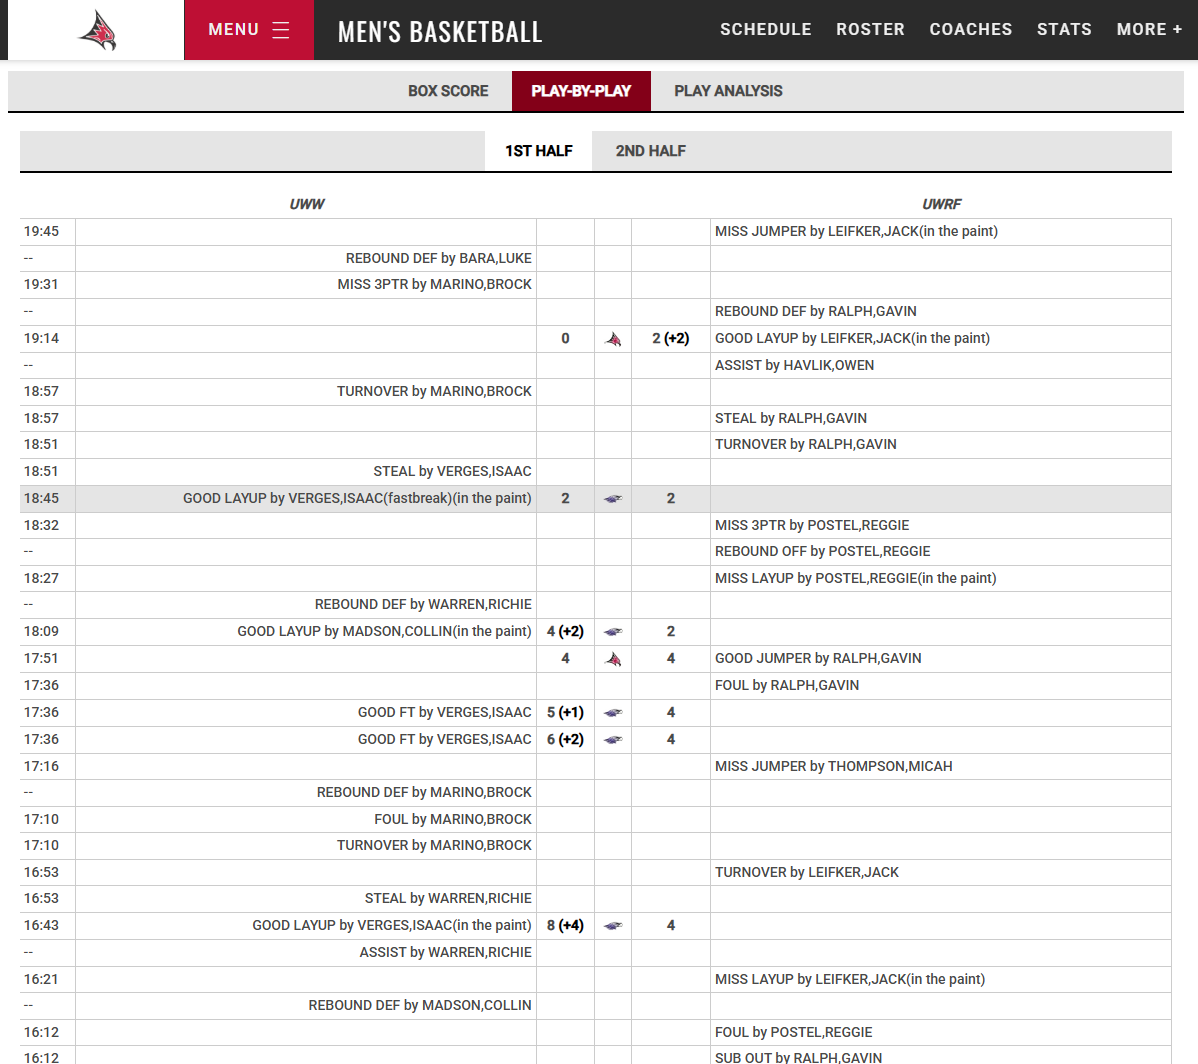
Our only source data was the play-by-play and box score PDFs UW-River Falls publishes for every game, the same documents anyone could pull off the athletics website. Buried alongside the box score was the substitution log: every player subbed in, subbed out, and every scoring event, in order.
Before writing any code, we calculated plus-minus by hand for one game to understand the problem. It took about an hour and revealed something important: our totals summed to +7. That's not possible in basketball, since plus-minus always nets out in multiples of five (five players per team on the court at once). River Falls had won that game by one point, so the total should have been ±5. The gap meant the play-by-play itself recorded moments with six or four players credited on the court at once. The problem wasn't just messy data; the source PDFs contained real inaccuracies we'd have to detect and correct.
My contribution
My work centered on the data pipeline and delivery layer, turning raw PDFs into something a coach could open and use. Specifically, I handled:
- Data extraction and storage: building the SQLite database and designing the schema for the extracted play-by-play data.
- The ETL pipeline: pulling data from PDFs stored in our shared GitHub repo, transforming it, and loading it into the database and then the Streamlit app.
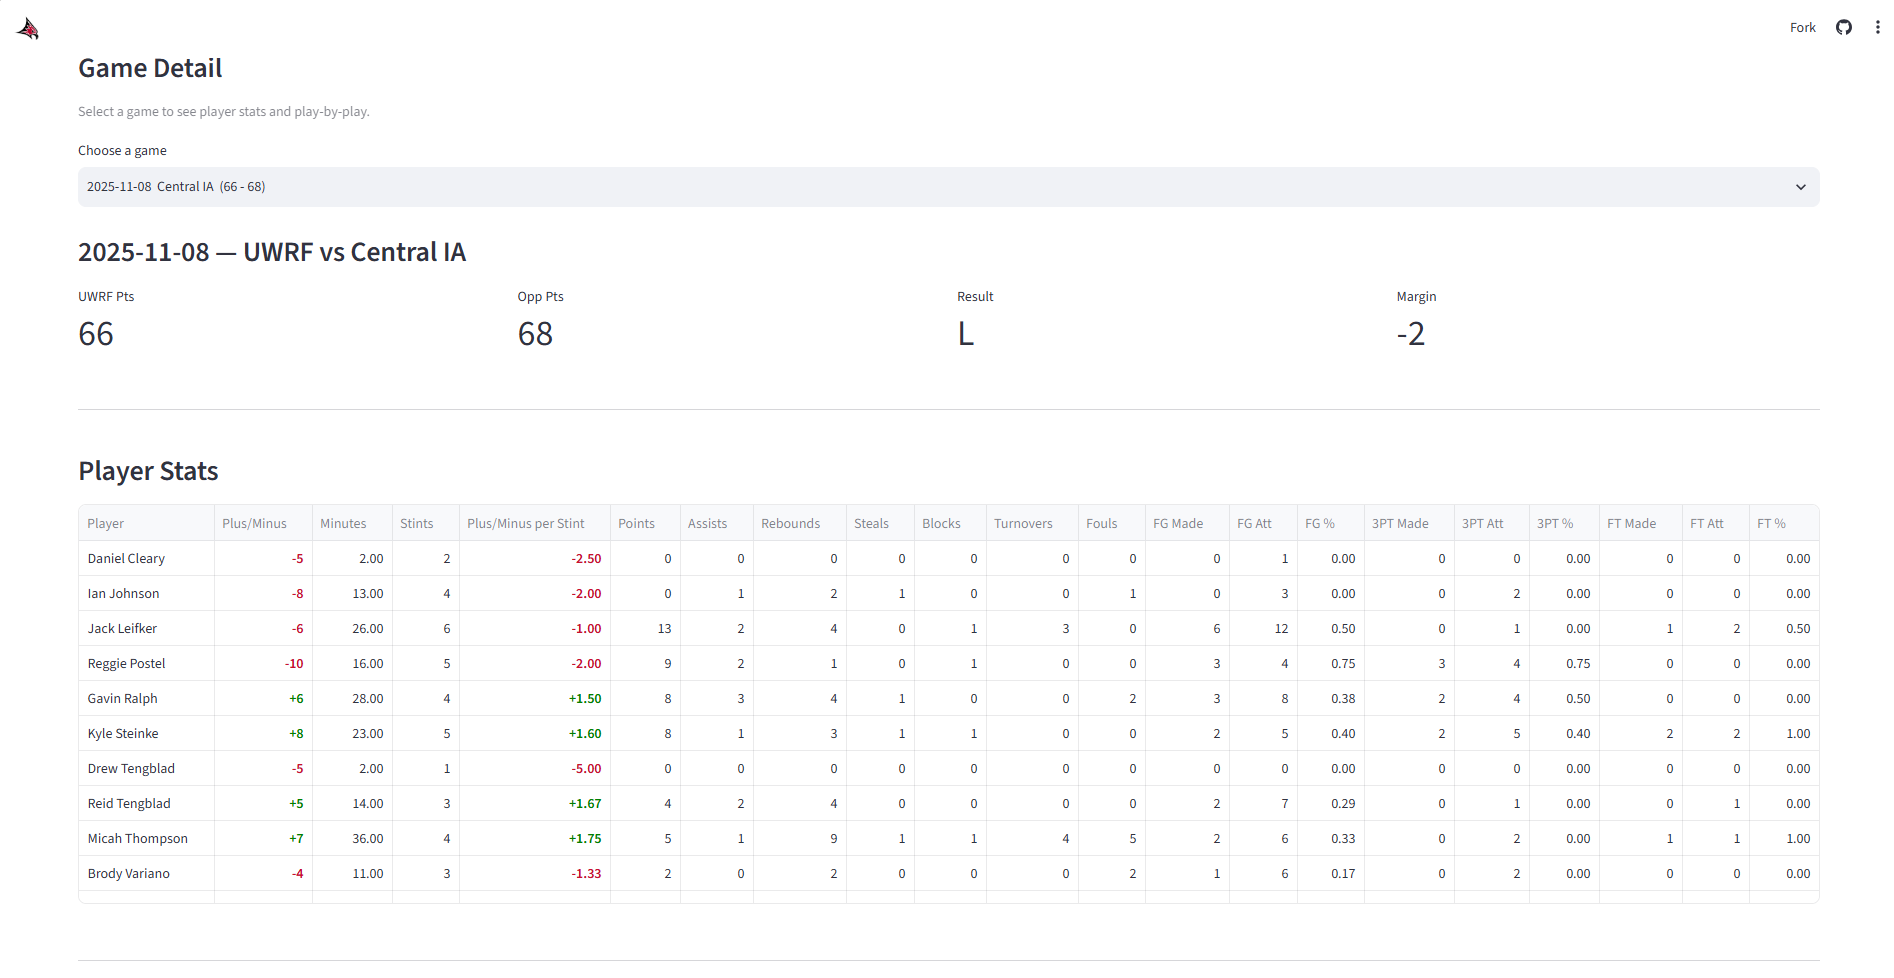
- The dashboard: most of the visual, coach-facing side of the project, including filters by conference or non-conference, home or away, lineup, player, game, opponent, half or timestamp, and margin of game.
- Coordination: keeping the team aligned across our weekly meetings and our results presented clearly.
The specific problem I owned was the substitution and free-throw conflict at the heart of the data. If two free throws were shot between two substitutions, the data ended up with six or four players credited on the court for that moment. My fix reordered events so that whenever a substitution shared a timestamp with another event, non-substitution events such as scores and fouls processed first, sub-outs came second to last, and sub-ins came last. That way, whoever was actually on the floor got credit for the play. This became the foundation the rest of the pipeline relied on.
Technical approach
We chose Python since it was the language all three of us knew best, and pdfplumber since our coursework had already shown it was the right tool for pulling text and tables out of PDFs like these. Extracted data was structured into a simple table, one row per event, loaded into SQLite, with our GitHub repo holding the source PDFs so the tool could run across every game automatically.
Each event was sorted by half, then timestamp, then the substitution hierarchy above. We also added a Lineup ID that only generated a new record when exactly five players were on the floor, which doubled as a check against the six-or-four-player error. We chose Streamlit over Power BI for the dashboard since it let us ship a URL the coaches could open from anywhere without installing anything. Plus-minus itself was calculated by tracking, for each player, every stat that occurred while they were on the court, from sub-in to sub-out, and summing the point swings across that window.
Difficulties and edge cases
- Free throws between two substitutions produced six or four active players for that stretch. I built the scoring, sub-out, sub-in ordering above, plus the five-player Lineup ID as a validation check. Otherwise, credit could land on a player who wasn't actually on the floor.
- One game had a genuine error in the source PDF itself, a mislogged substitution, not our parsing. We turned that failure into a warning instead of a crash, since no scores were affected, and let the game still count toward the season. A tool that halts on every imperfect record isn't usable across a real season.
- One game's events were split across multiple PDF lines, and another game's box score used a different format entirely. We merged split lines back into single events and handled the outlier format as a special case. A parser built for one layout will silently break on the next unless tested against real variation.
- Total lineup minutes came in short of total game time, off by about 11 to 12 minutes across 1,005 season minutes. We traced it to missing time at the start and end of periods and added explicit period-boundary events before sorting. Without boundary events, the first and last seconds of every period were invisible to the lineup tracker.
We also fixed an overtime period mislabeled as "Half 2" and one game that wasn't computing plus-minus at all due to a lineup bug.

Validation
Our clearest validation came from the manual, hand-calculated game where totals summed to +7 instead of the expected +5. From there, we built an automated check that total plus-minus for any game always equals five times the point differential, plus a spot check on total lineup minutes against total game time, which is what surfaced the boundary-event bug above.
Result and use
Over about six weeks in spring 2026, we processed all 26 games from the season. Coaches could view plus-minus by player, game, or any combination of filters, useful for seeing how the team performed against a particular opponent or defense, and lineup and partnership views showed how any two or more players performed together across the season.
We presented the tool to the head coach and an assistant coach in early May. They responded well, especially to the lineup views, and asked for password-protected access and the ability to view a player's plus-minus over their most recent games. We added authentication through Streamlit before handoff. The tool has been adopted and is still in use, and the staff has said they'd bring us in again for future projects.
Reflection
I'm grateful to have been trusted by my peers and professors with a project like this. Working on something with real stakes, a tool an actual coaching staff would use to make actual decisions, felt entirely different from building a dashboard off a public dataset for a class assignment.
One honest limitation: even after fixing the missing boundary events, our season-total lineup minutes were still off by about 11 to 12 minutes out of 1,005, which we attribute to rounding rather than a structural bug, but it's not perfectly reconciled. If I extended this project, I'd add the per-stint plus-minus printout and "last N games" filter the coaches asked for, and build the same tool for the women's team.
Just as valuable was learning to work efficiently as a three-person team while all of us were full-time students juggling coursework and a full slate of extracurriculars. Dividing responsibilities clearly and still shipping something the coaches could rely on by season's end was, in its own way, as big a takeaway as anything on the technical side.
See the code
The dashboard itself is password-protected because the coaching staff keeps the data confidential. The pipeline and dashboard code are public on GitHub.
View the repository